Renewables Fudginess
In the main post, I shared a timeline of global primary energy consumption from 1800-2019. Here it is again for your reference1:
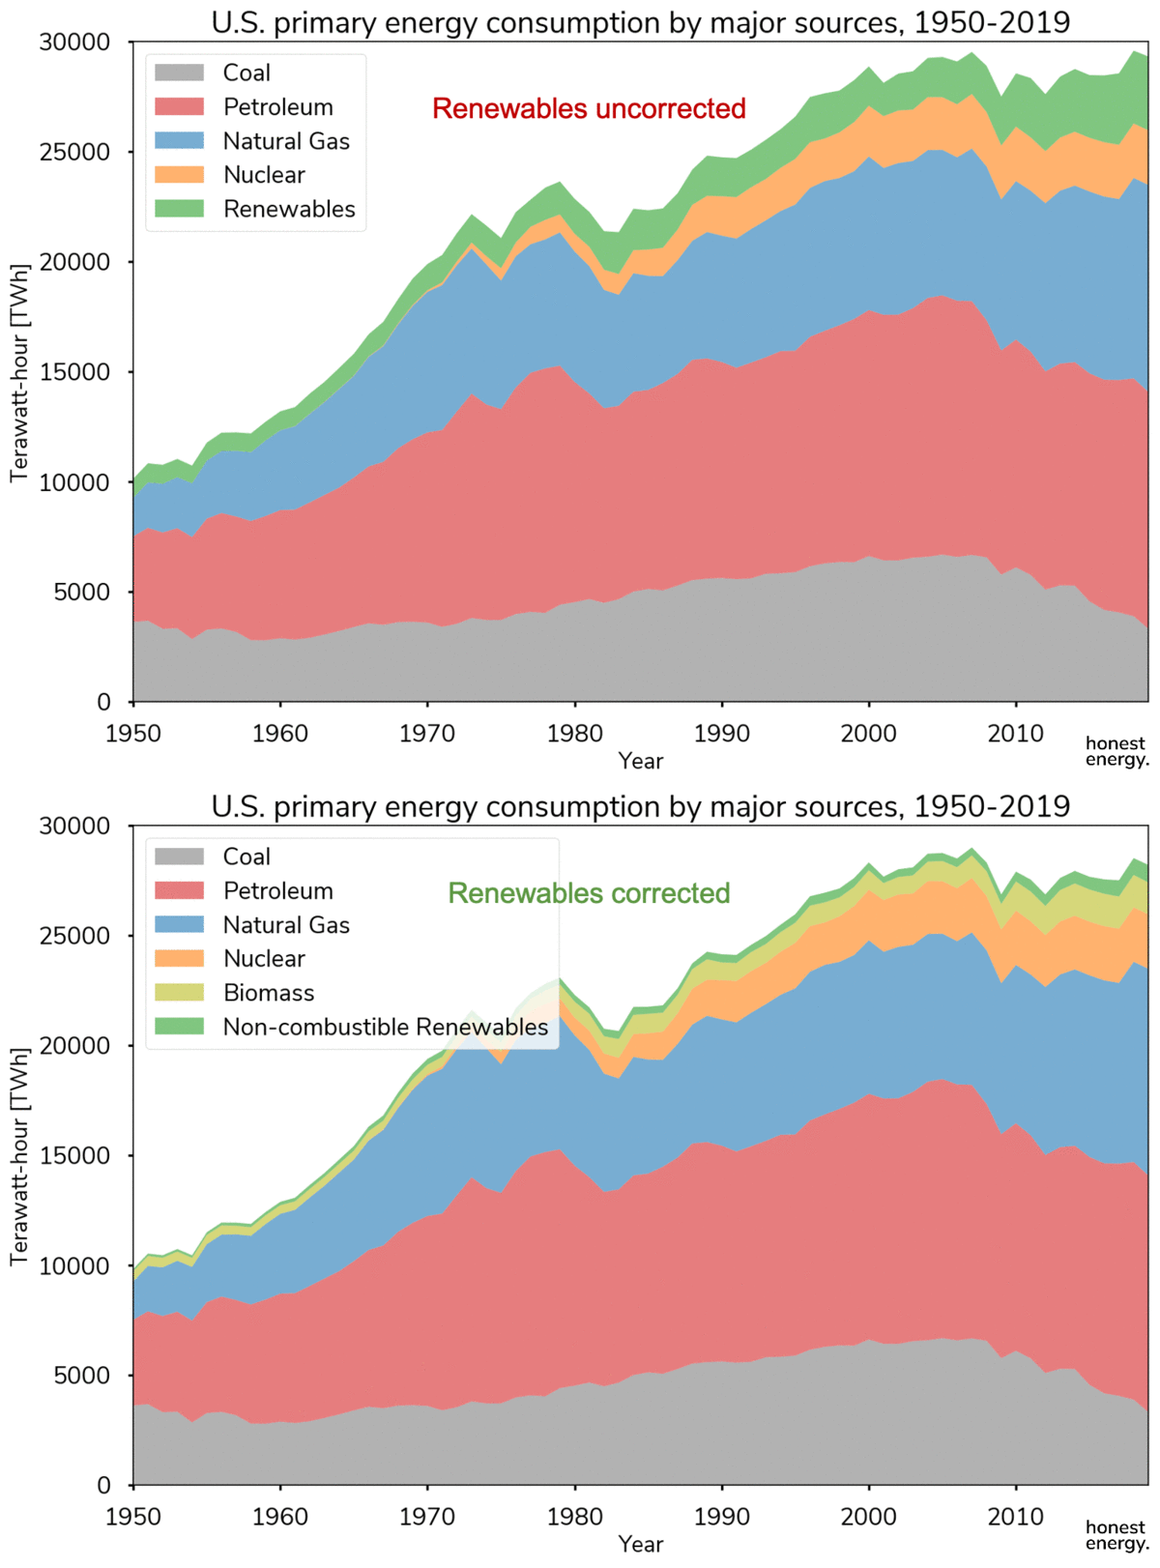
Now if we look at just the U.S. instead, the below graph shows the same information for U.S. primary energy consumption only between 1950 and 2019. The raw data was downloaded from the U.S. Energy and Information Administration (EIA)2. Since the EIA reports information using Quads (quadrillion Btus), I’ve converted all units to TWh and re-plotted below in keeping with using consistent units.
Through my calculations and poring through the footnotes of EIA documentation, I realized the actual numbers for renewables in the data above are actually kind-of “fudged”. This is because they are attempting to fit renewables into a “primary energy” bucket with no real way of quantifying the energy content in the “original fuels”, since it doesn’t really apply. As you may imagine, it’s rather hard to quantify the “original energy” content in wind. Here’s EIA explaining how they tried to fit the square peg into the round hole in a footnote found on page 233 in a 272-page report:
“There is no generally accepted practice for measuring the thermal conversion rates for power plants that generate electricity from hydro, geothermal, solar thermal, photovoltaic, and wind energy sources. Therefore, EIA calculates a rate factor that is equal to the annual average heat rate factor for fossil‐fueled power plants in the United States…By using that factor it is possible to evaluate fossil fuel requirements for replacing those sources during periods of interruption, such as droughts.” 3
What this means is that they are multiplying the actual energy generated by renewable energy sources arbitrarily by 2.61x to represent what it would take in original fossil fuel energy terms. Instead of multiplying 1 kWh by 3,412 to get Btus (see our conversion table in the main post), they are multiplying it by 8,904 instead to normalize for fossil fuel thermal conversion inefficiencies (here they are estimating 38.3% efficiency), and that’s just 2019’s multiplier (it changes). This makes it seem like we use more renewables than we actually do, and also makes it appear as if renewables are less efficient than they actually are.
Boom. Honest Energy already playing that honesty card.
I’ve corrected the plot above based on raw data from additional appendices provided by the EIA4 5. Here I am calculating the primary renewable energy consumption based on the actual energy (mostly electricity) generated. For hydroelectricity and wind where mechanical energy is converted into electrical energy, I assumed 95% efficiency in converting energy from the “original fuel”. For geothermal energy that is converted into electricity, steam turbines must be used so I assumed 38% efficiency which should be typical. For solar, I am just using the actual electricity (from distributed rooftop solar and utility solar) and direct solar thermal energy generated. It would be misleading to report the total incident sunlight collected by the panels due to the low energy conversion efficiencies of photovoltaic panels (~15%), and it didn’t take us any work to drill, frack, or mine for sunlight. Finally, biomass is presented the same way fossil fuels are, because they are combustible fuels. 40% of all the renewable primary energy came in the form of biofuels for the transportation sector (a.k.a. ethanol from corn), which still produce CO2 upon combustion. This makes up the majority of biomass in general, which includes burned wood and waste. I’ve separated them in the final plot to show the actual energy we are getting from non-combustible renewable energy sources. If you were excited for a second about the amount of energy we get from clean, non-combustible renewable energy, I’m sorry I burst your bubble. Unfortunately, it’s just a sliver.
https://ourworldindata.org/grapher/global-energy-substitution?time=earliest..latest
https://www.eia.gov/energyexplained//us-energy-facts/charts/primary-consumption-by-major-source.csv
https://www.eia.gov/totalenergy/data/monthly/pdf/mer.pdf
https://www.eia.gov/totalenergy/data/browser/xls.php?tbl=TE1A&freq=a
https://www.eia.gov/totalenergy/data/browser/xls.php?tbl=TE1B&freq=a


Wow. Is it just the EIA that does this misleading conversion or have you seen it show up in other statistics too?